목차
들어가기
앞서, Qt로 ping 결과 출력하기와 그래프 라이브러리인 QCustomPlot 소개를 했는데, ping 결과를 QCustomPlot으로 표시하는 것을 해보려 한다. 이왕이면 그래프로 보는 것이 직관적이니까...
2022.08.02 - [놀기/Qt] - Qt로 ping 결과 출력하기
Qt로 ping 결과 출력하기
목차 시작하기 다들 ping에 대해서 대충은 알 것이다. 물론, 나도 대충만 알고 자세히는 모른다. 어쨌든, OS에 ping이라는 프로그램이 기본으로 포함되어 있고 이 프로그램을 사용하여 쉽게 ping 테
busyman.tistory.com
2022.08.03 - [놀기/Qt] - QCustomPlot - Qt로 그래프를 그려보자.
QCustomPlot - Qt로 그래프를 그려보자.
https://www.qcustomplot.com/ Qt Plotting Widget QCustomPlot - Introduction QCustomPlot is a Qt C++ widget for plotting and data visualization. It has no further dependencies and is well documented...
busyman.tistory.com
UI 구성
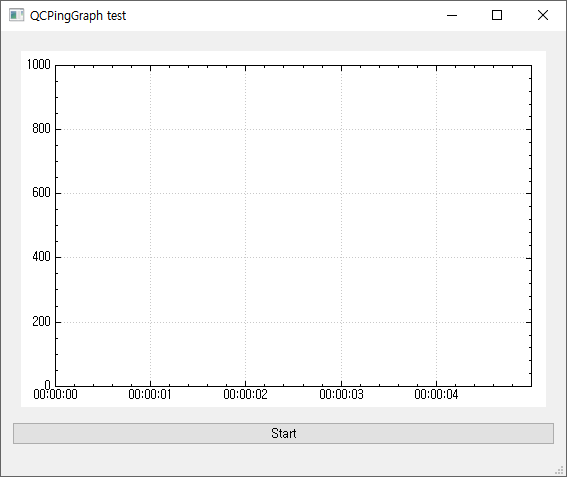
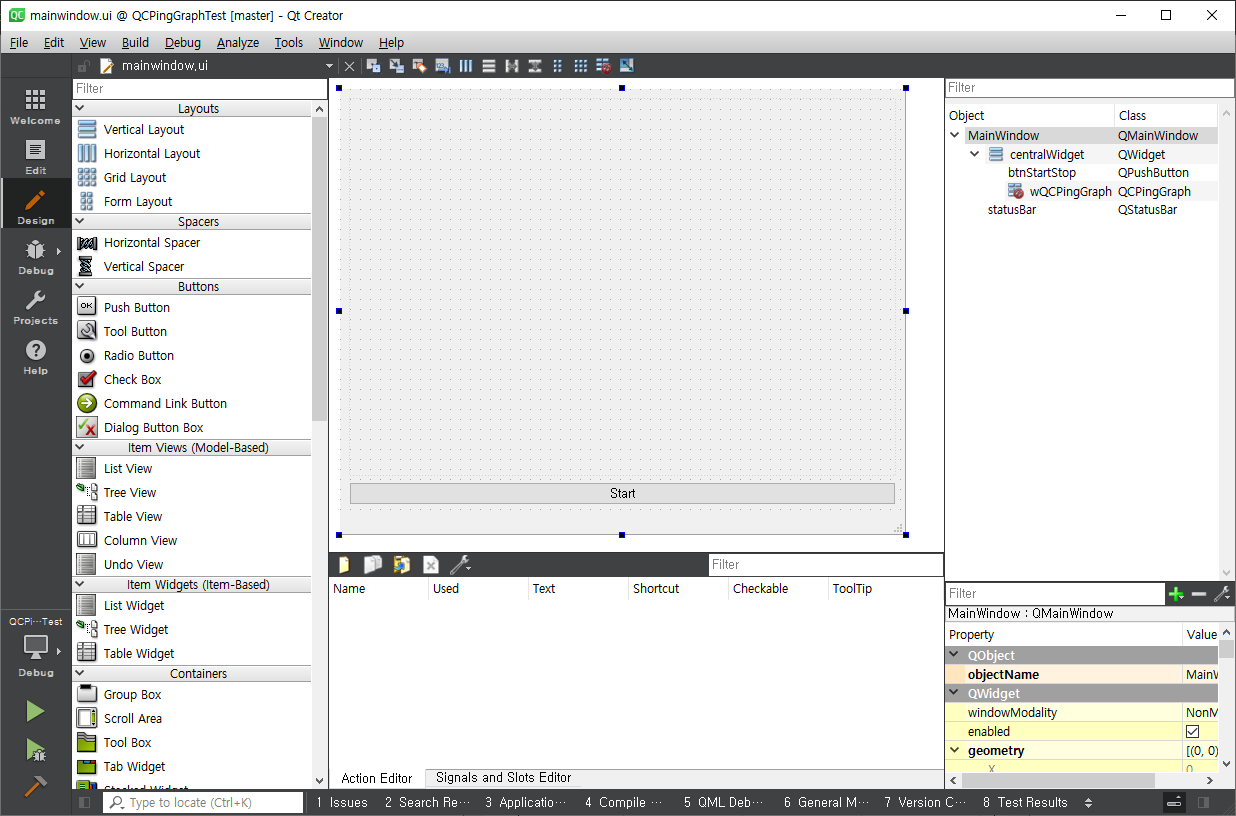
완성도보다는 해보는 것에 목적이 있으니 아래와 같이 UI는 간단히 구성하자. Start 버튼을 누르면 하드 코딩된 구글 페이지 (www.google.com)로 ping을 보낸다. ping 결과는 ms 단위로 그래프에 표시한다.

프로그램 기본 구조
ping 실행 코드와 QCustomPlot을 QCPingGraph Widget으로 구성한 후, QCPingGraph Widget을 가져다 쓰는 형식으로 하였다.

사용하는 코드는 역시나 간단하다. 'Start' 버튼을 누르면 ping을 시작한다.
void MainWindow::on_btnStartStop_clicked()
{
    if (ui->btnStartStop->text().compare("Start") == 0) {
        ui->wQCPingGraph->setIP("www.google.com");
        ui->wQCPingGraph->ping(true);
        ui->btnStartStop->setText("Stop");
    }
    else {
        ui->wQCPingGraph->ping(false);
        ui->btnStartStop->setText("Start");
    }
}
ping 코드는 이전 게시물의 내용과 동일하고 그래프를 표시하는 QCustomPlot 코드는 QCustomPlot의 plots 예제 코드를 사용하여 간단히 구성했다.
void QCPingGraph::setup(QCustomPlot *w)
{
    w->addGraph(); // blue line
    w->graph(0)->setPen(QPen(QColor(40, 110, 255)));

    QSharedPointer<QCPAxisTickerTime> timeTicker(new QCPAxisTickerTime);
    timeTicker->setTimeFormat("%h:%m:%s");
    w->xAxis->setTicker(timeTicker);
    w->axisRect()->setupFullAxesBox();
    w->yAxis->setRange(-1.0, 1000.0);

    // make left and bottom axes transfer their ranges to right and top axes:
    connect(w->xAxis, SIGNAL(rangeChanged(QCPRange)), w->xAxis2, SLOT(setRange(QCPRange)));
    connect(w->yAxis, SIGNAL(rangeChanged(QCPRange)), w->yAxis2, SLOT(setRange(QCPRange)));
}
ping 결과를 signal로 받으면 아래와 같이 graph를 업데이트 한다.
void QCPingGraph::slotGetResponseTime(qlonglong us)
{
    QDateTime currTime = QDateTime::currentDateTime();

    qDebug() << "time : " << us;
#if 0
    if (us >= 0) {
        ui->editPingTimeRecord->textCursor().insertText("[" + currTime.toString("yyyy-MM-ddT hh:mm:ss") +
                                                    "] " + QString::number(us) + "us\n");
    }
    else {
        ui->editPingTimeRecord->textCursor().insertText("[" + currTime.toString("yyyy-MM-ddT hh:mm:ss") +
                                                    "] timeout\n");
    }
#endif

    static QTime timeStart = QTime::currentTime();
    // calculate two new data points:
    double key = timeStart.msecsTo(QTime::currentTime())/1000.0; // time elapsed since start of demo, in seconds
    static double lastPointKey = 0;
    if (key-lastPointKey > 0.002) // at most add point every 2 ms
    {
      // add data to lines:
      widgetPingGraph->graph(0)->addData(key, us/1000.);
      lastPointKey = key;
    }
    // make key axis range scroll with the data (at a constant range size of 8):
    widgetPingGraph->xAxis->setRange(key, 8, Qt::AlignRight);
    widgetPingGraph->replot();
}
이게 전부다. 너무 간단한가?
실행해보기
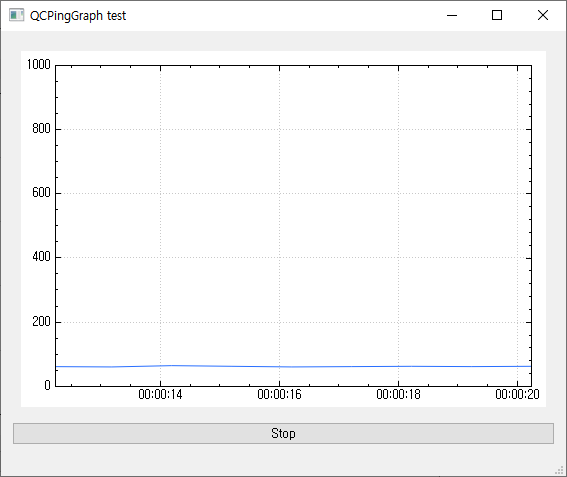
실행하면 아래와 같이 ping 결과가 표시된다.

마무리
너무 간단해서 민망할 정도다. 아주 간단하게 구성했는데 예쁘게 수정할 부분이 여럿 있다.
- ping 결과 시간에 따라 범위를 동적으로 수정
- 지정된 최대치에 도달할 경우 알람 (배경색을 변경한다던지...)
- ping 결과 시간 저장 기능
- scrollbar 추가
- Pause 기능 추가
마지막으로 허접하지만 코드가 필요하신 분은 아래 참조
https://github.com/busymankr/QCPingGraphTest
GitHub - busymankr/QCPingGraphTest
Contribute to busymankr/QCPingGraphTest development by creating an account on GitHub.
github.com
'놀기 > Qt' 카테고리의 다른 글
| Qt QLabel로 Drag & Drop Widget 만들기 (0) | 2022.10.11 |
|---|---|
| Qt Creator 조금이라도 빠르게 - Updates Check 끄기 (0) | 2022.10.11 |
| QCustomPlot - Qt로 그래프를 그려보자. (0) | 2022.08.03 |
| warning: '_sleep' is deprecated (0) | 2022.08.01 |
| ffmpeg을 활용한 transcoder 만들기 (QProcess, 정규식 활용) (0) | 2022.05.06 |


댓글